How to monitor Db2 LUW databases — an overview
If you already have some experience with Db2 LUW or you just read a bunch of Db2 blog articles, you have probably noticed that there are plenty of ways to monitor databases: db2top, dsmtop, dmctop, db2pd, MONREPORT module, MON_GET table functions, snapshots, SYSIBMADM views etc. But, what’s best? Is it a matter of preferences or a matter of case? Well… it’s complicated. But I promise, by the end of the article you’ll have a clear picture of which tool is best for you and your case.
Quick look at the available options
Snapshots
At first, let’s talk about snapshots. “GET SNAPSHOT…” is the oldest monitoring tool that I know (it exists since the dawn of Db2 LUW). Although snapshot monitoring was deprecated by IBM a few years ago, you can still use it. I think the only reason snapshots are still in use is that DBAs who are 15+ years on the market are used to them and that the least experienced DBAs find them on Internet in posts from 15 years ago when looking for a solution to their problem. Or… someone still works with Db2 9.5 or older (9.5 was released in 2007). The problem with snapshots is that they have high impact on the database and they don’t offer anything that you couldn’t do better with newer tools (the same applies to SYSIBMADM.SNAP views).
If you still want to learn about snapshots, take a look at the IBM Documentation (GET SNAPSHOT command — IBM Documentation) and Ember Crook’s blog article from 2013 (Two Worlds of DB2 LUW Performance Monitoring).
db2pd
The first lightweight alternative to snapshots was db2pd (since 8.2 released in 2004). This tool is still widely used, especially by more experienced DBAs, because if you know its extended syntax well, you can get the metrics of your interest very quickly. Also, you can easily send the output to a file. Another strong point of db2pd is that it doesn’t require a database connection, which is not so common in newer tools.
Therefore I do use db2pd for some quick checks like checking which tablespace is in abnormal state:
db2pd -d DB_NAME -tablespaces
or if logs are being archived correctly:
db2pd -d DB_NAME -logs
However, if you’re new to the business, don’t focus on this tool. There are easier-to-use alternatives down there. Moreover, db2pd doesn’t support remote database connections.
db2top, dsmtop and dmctop
You can think of db2top, dsmtop and dmctop as 3 versions of the same tool. Although they still have text-based terminal interfaces, they’re interactive. If you know Unix/Linux ‘top’ command, you already know how it looks like (the ‘db2top’ name cannot be a coincidence). db2top was introduced around 2005 and it’s based on snapshots. As previously mentioned, snapshots are quite heavy (high impact on database performance), therefore in 2012 dsmtop was released. It was mentioned to replace db2top, but DBAs didn’t like it (more about it in this blog article) and db2top was still on top until recently. The second attempt to replace db2top came in 2016, when dmctop was released. It solved the shortcomings of dsmtop, and completely took over its market. However, even today there are lots of DBAs using db2top. I think there are two reasons for that. Firstly, db2top has its advantages, namely it doesn’t require Java and you don’t have to connect to the database. Secondly, DBAs are so much used to it. On the other hand it is impacting the database more, since it’s based on snapshots, therefore IBM deprecated it along with snapshots. Moreover, db2top unlike its successors doesn’t work for remote connections.
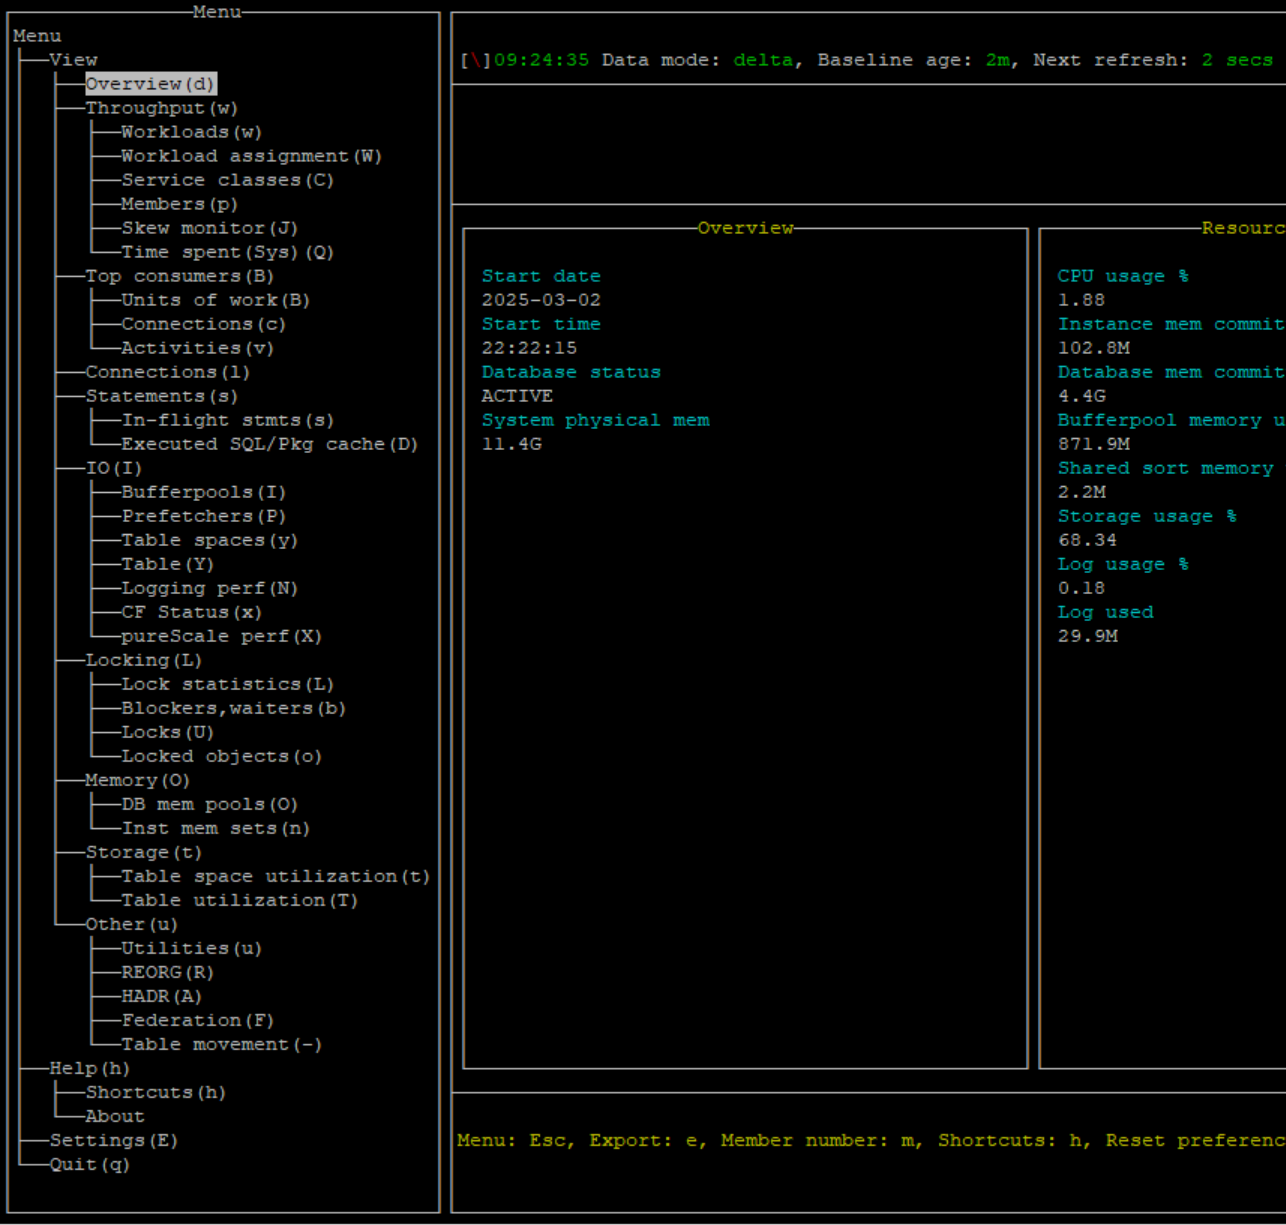
In my opinion you should only use dmctop. Leave db2top for those who find it difficult to change their habits. dmctop is a perfect tool for newbies, because you can check all you need using just keyboard arrows and you even don’t have to know what to check — all the options are displayed in the menu (the left pane):
MONREPORT module
There is a tool similar to db2pd in its usage that use MON_GET table functions, namely MONREPORT. The aim of this tool is collect key metrics in a specified time interval (like 30 seconds) and print the analysis on the screen. Note, that MONREPORT doesn’t give you immediate response, because it needs to collect the data first (for the time you specified). So, for example, if you want to see the database performance overview of the next 60 seconds, run:
db2 "CALL MONREPORT.DBSUMMARY(60)"
Or maybe you want to check what SQL statements are active or who is connected to the database during a specified time?
db2 "CALL MONREPORT.CURRENTSQL(<time-interval>)"
db2 "CALL MONREPORT.CONNECTION(<time-interval>)"
You may say that it’s easier to use dmctop to check those. In most cases You would be right, but MONREPORT has one important characteristic that may be useful in very specific cases: it collects the data from the time interval that you specify (e.g. between 12:05 and 12:10) and lets you analyse or save the output to a file, while dmctop shows you the real-time values that change every few seconds.
MONREPORT is built on MON_GET table functions (I mean it executes MON_GETs under the hood), therefore it has similar characteristics, e.g. it supports remote connections. However, the output is different, namely you get data on the screen in a format prepared for humans instead of the SQL data that you can use in further queries.
MON_GET table functions
The mentioned tools let you see how the situation looks like. But what if you want to script it and use in further processes or you want to modify the output by aggregating some data or join with other results? In such cases you would prefer to get an output in a form of a SQL table instead of plain numbers on the screen. MON_GET table functions give you such an output. Thanks to that you can use it in a SQL pipeline (or script) across different RDBMSes, easily filter and sort the output.
Here are some examples of MON_GET queries that I pulled from the Db2 Documentation:
- identify the units of work that are consuming the highest amount of CPU time on the system:
SELECT application_handle, uow_id, total_cpu_time, app_rqsts_completed_total, rqsts_completed_total
FROM TABLE(MON_GET_UNIT_OF_WORK(NULL,-1)) AS t
ORDER BY total_cpu_time DESC
- list the activity on all tables accessed since the database was activated, aggregated across all database members, ordered by highest number of reads:
SELECT varchar(tabschema,20) as tabschema, varchar(tabname,20) as tabname,
 sum(rows_read) as total_rows_read, sum(rows_inserted) as total_rows_inserted,
 sum(rows_updated) as total_rows_updated, sum(rows_deleted) as total_rows_deleted
FROM TABLE(MON_GET_TABLE('','',-2)) AS t
GROUP BY tabschema, tabname
ORDER BY total_rows_read DESC
As you see, this is a powerful and flexible tool, but the syntax like TABLE(MON_GET_TABLE(‘’,’’,-2)) seems odd at the beginning.
MON_GET can actually replace every other tool, however it’s quite difficult to use (especially if you’re not very proficient in SQL language), so it won’t replace dmctop with its nice and easy-to-use interface or quick db2pd checks. Also, it takes some time to write a proper command.
Yet, if you’re looking for something more advanced, something that lets you filter and sort, something that you can use in your monitoring scripts and get the output in the form of a table, use MON_GET functions. You can use MON_GET also in remote database connections. More about MON_GET table functions you can find here (the IBM Db2 Documentation) https://www.ibm.com/docs/en/db2/12.1?topic=functions-monitor-mon-routines
To sum up…
- For me, dmctop is the most important and mostly often used tool. If you are new in the Db2 world, start with this one, because it’s easy to use, easy to master. If you don’t have Java on your machine or your Db2 version is too old for dmctop, use db2top.
- If you need to collect data from a specified period of time, consider using MONREPORT module.
- In case you need to use the results/output in you script or in a SQL query, use MON_GET table functions.
- If you want to get the results quickly, use db2pd tool that doesn’t require database connection and sends you the output immediately.